Borehole Problems
These procedure steps will be followed on the simulator
Contour Map 1
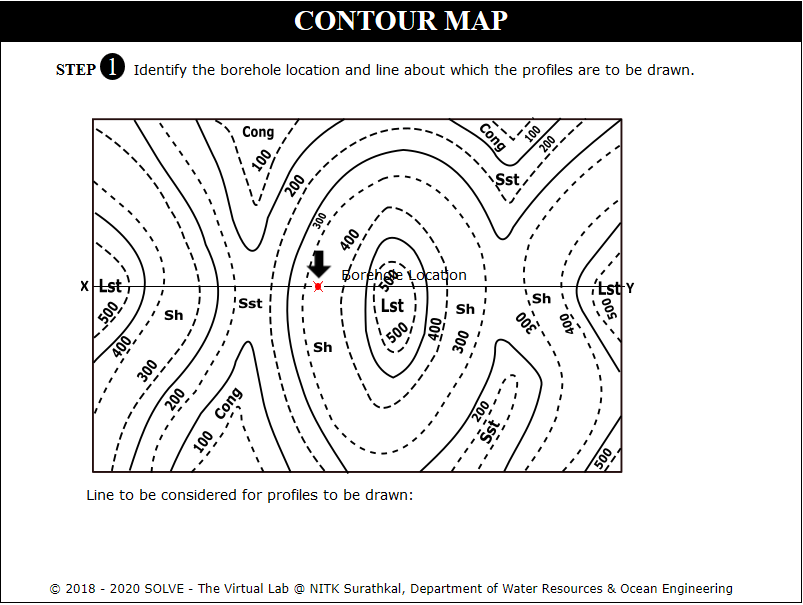
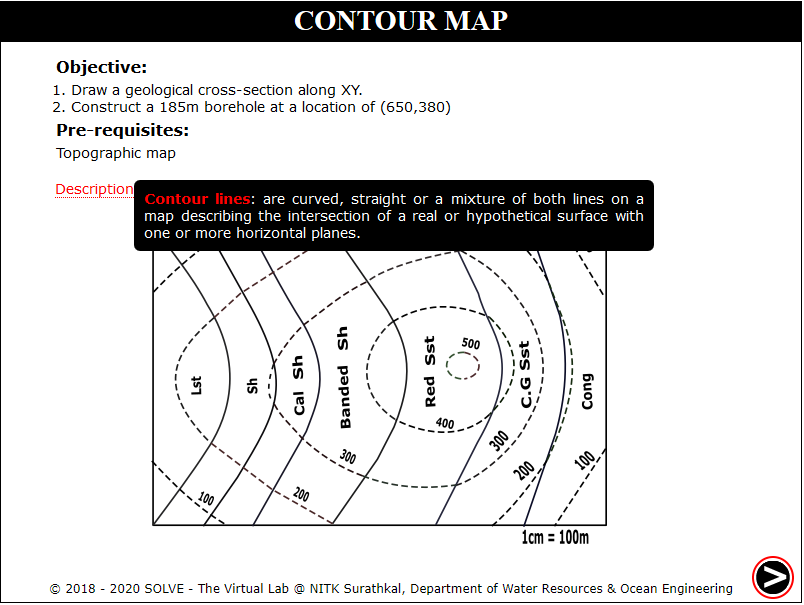
When you click on a Contour Map 1 file, a new window will open, click on the Next button at the bottom right corner to move to the next step.

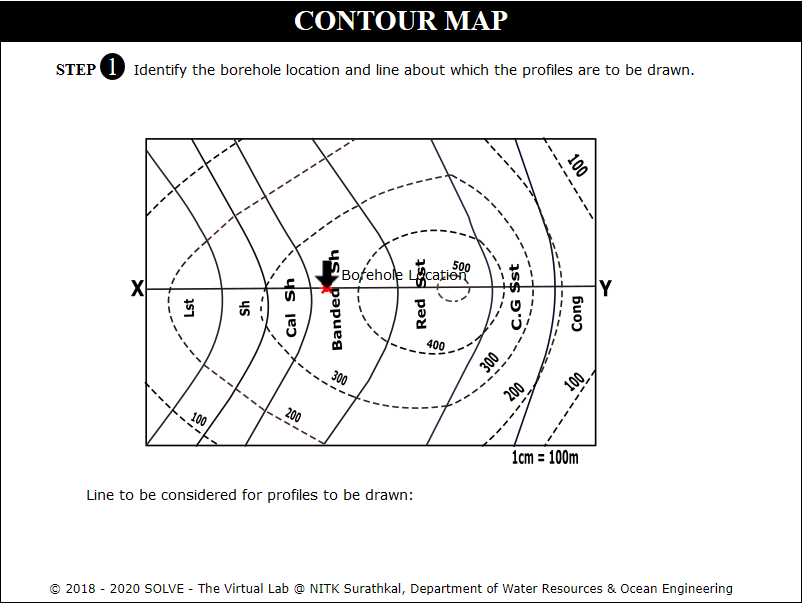
Click on to identify the location of the borehole. Click Next.
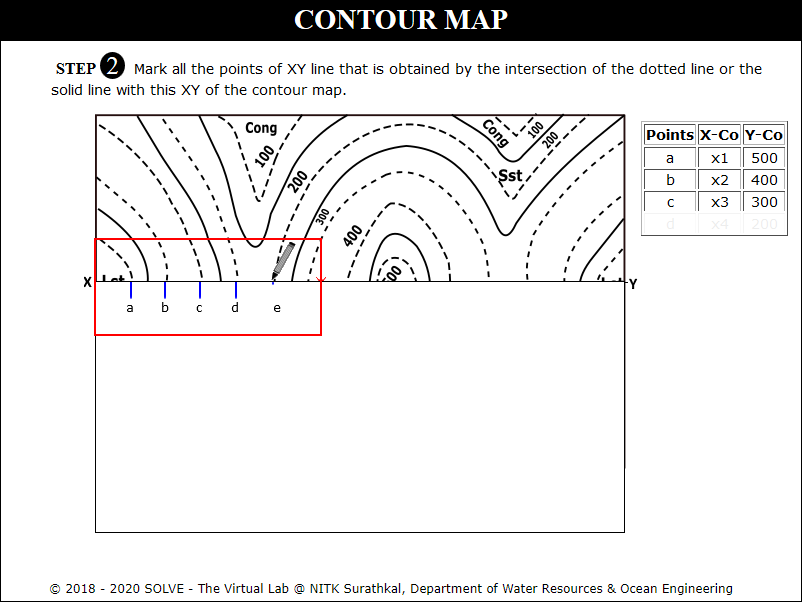
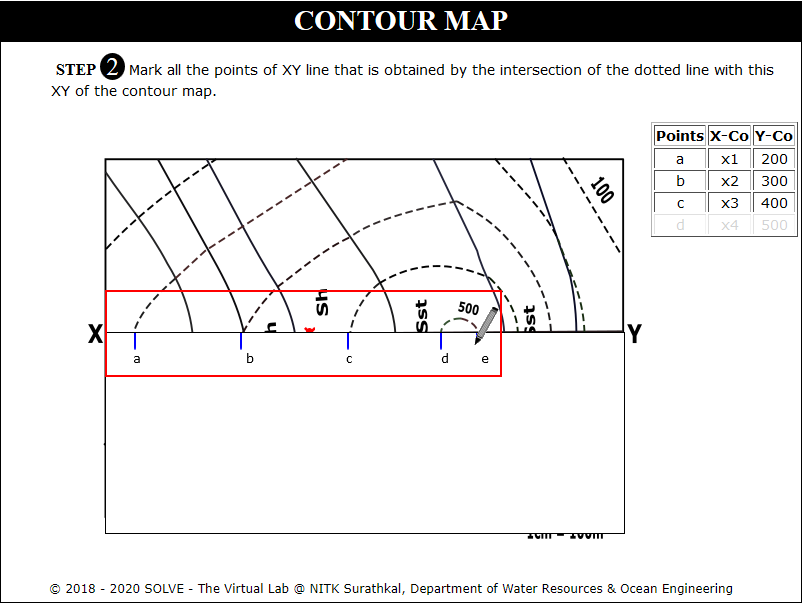
Click on Get paper and Mark Points to mark dotted lines intersecting the XY profile. Click Next.
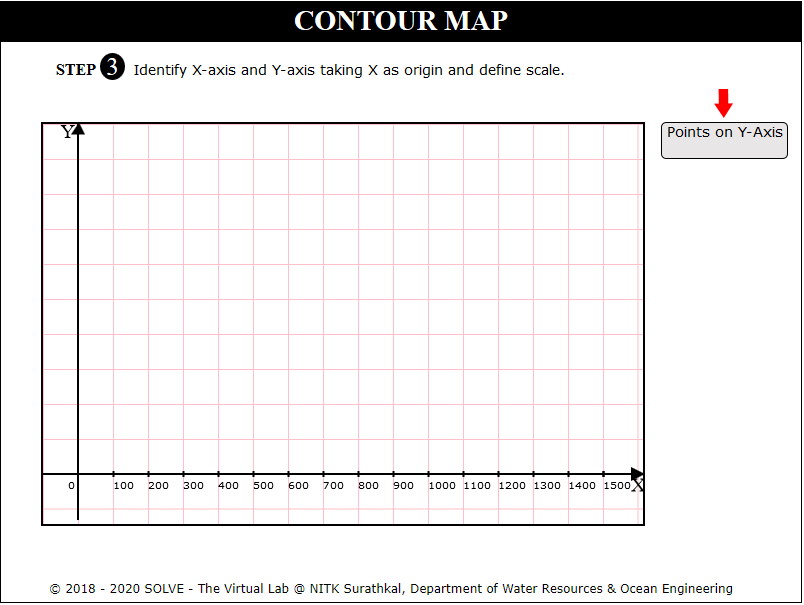
Click on Plot X Axis, Plot Y Axis, Points on X Axis, Points on Y Axis to plot axis of the graph. Click Next.
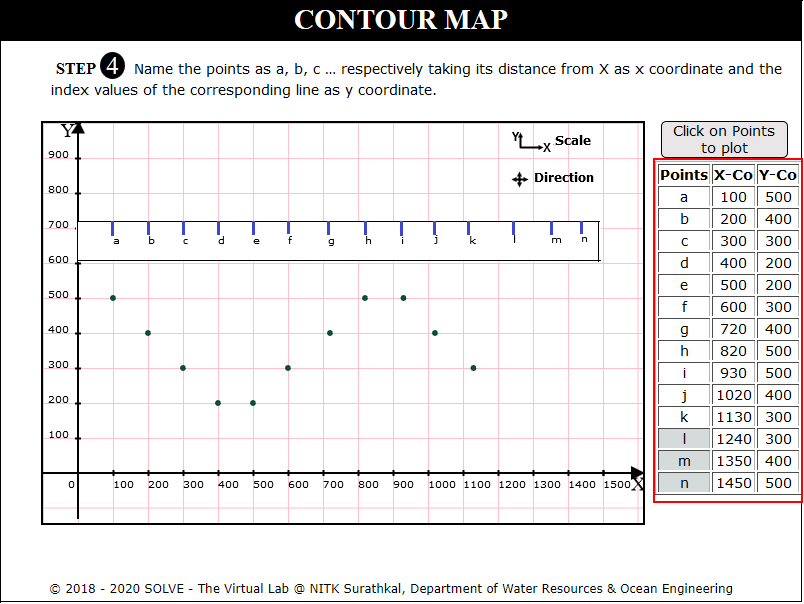
Click on Define Coordinates and click on each point to plot on the graph. Click Next.
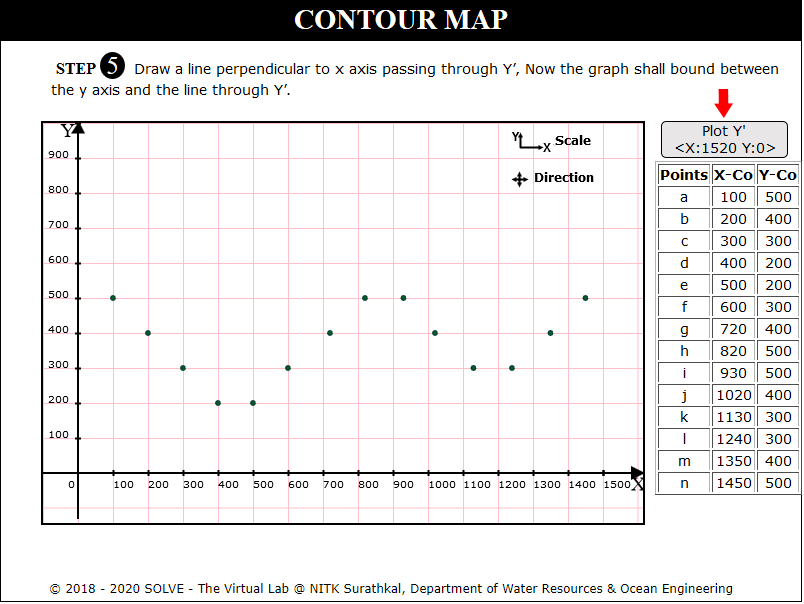
Click on Plot Y' X:1520 Y:0 to draw perpendicular line at Y=1520. Click Next.
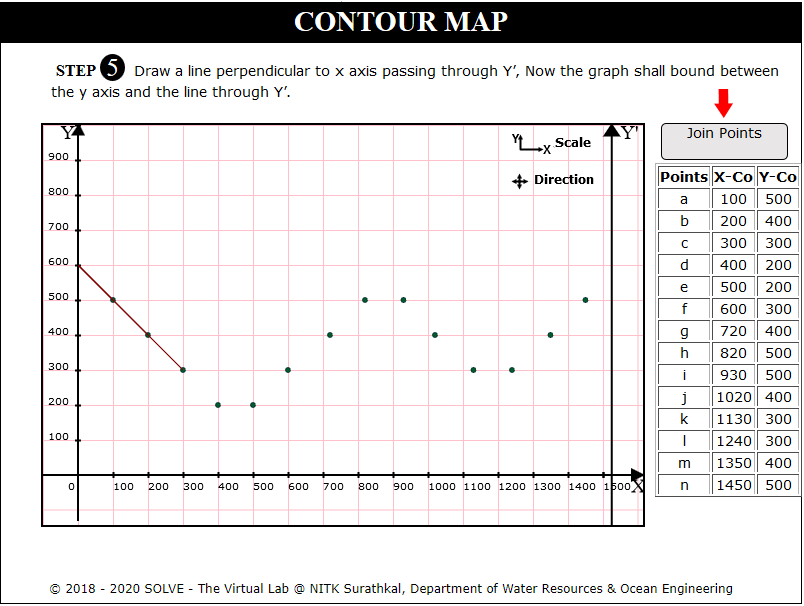
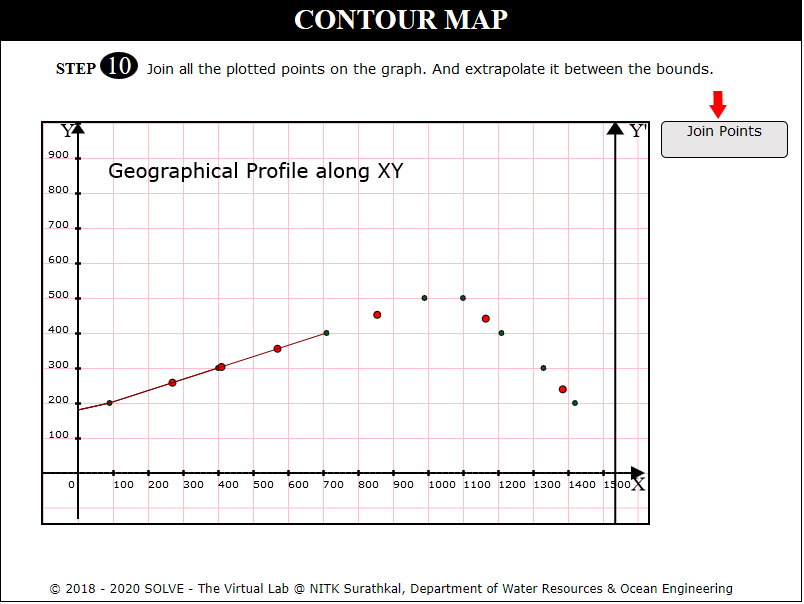
Click on Join Points.Click Next to proceed.
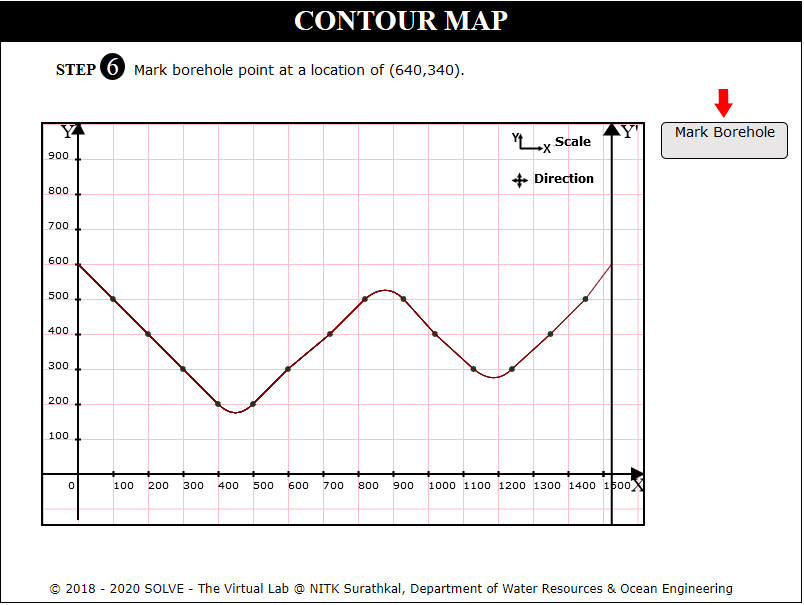
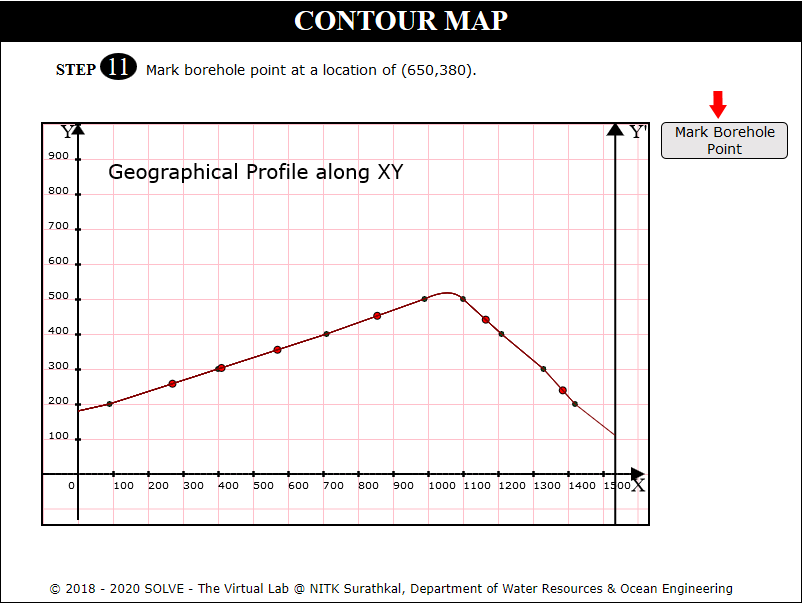
Click on Mark Borehole to locate the location of Borehole in the section, Click Next.
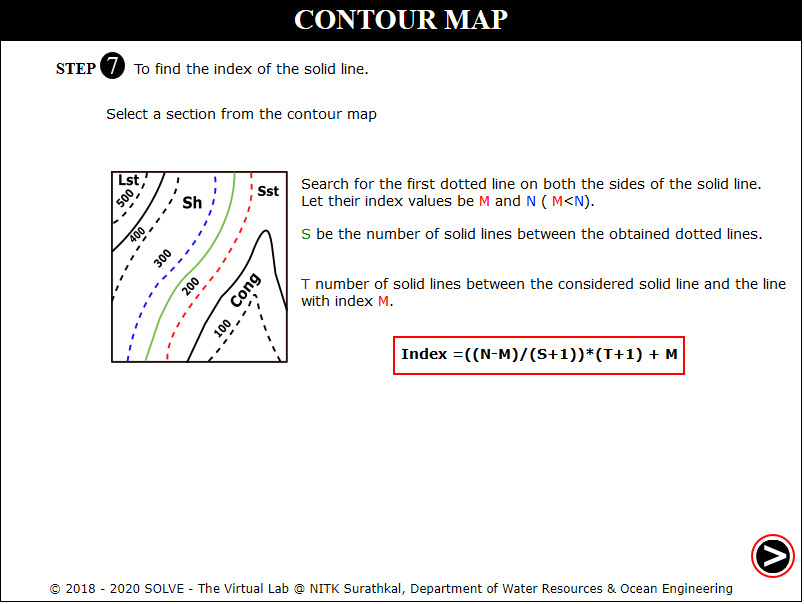
Read the instructions and formula to calculate the index of solid lines.
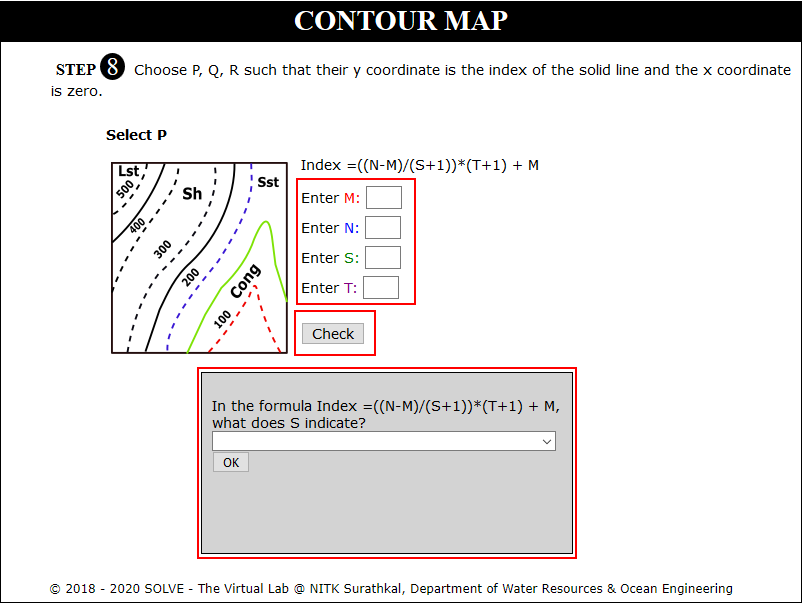
Click on to answer the displayed question, calculate the index of each solid line by selecting appropriate M and N value.
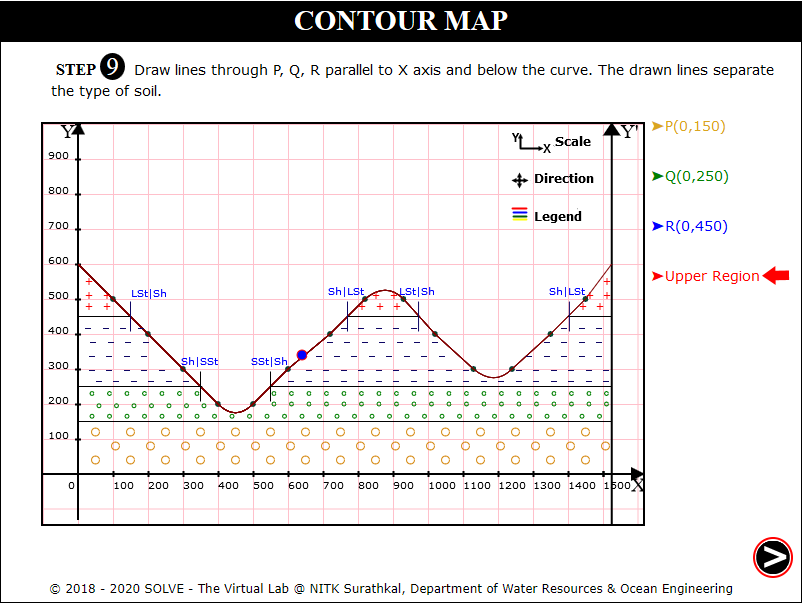
Click on to draw lines parallel to X Axis. Click Next.
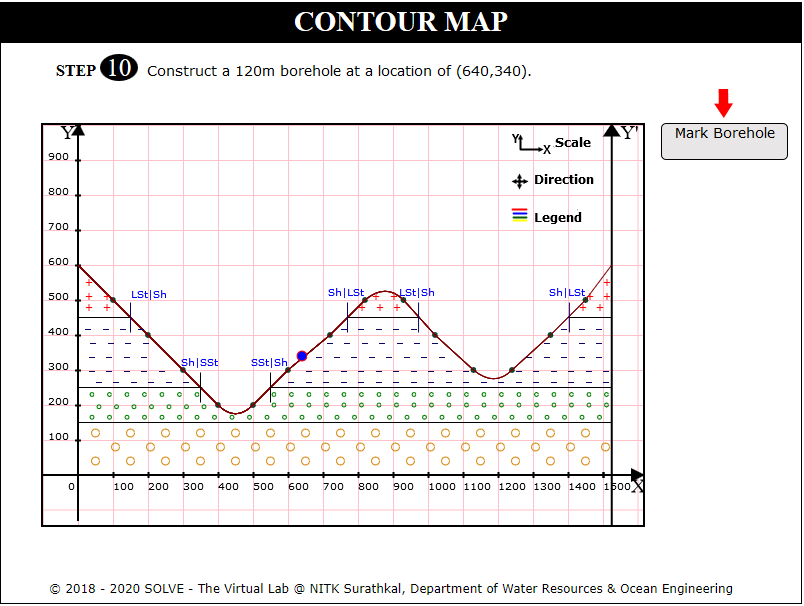
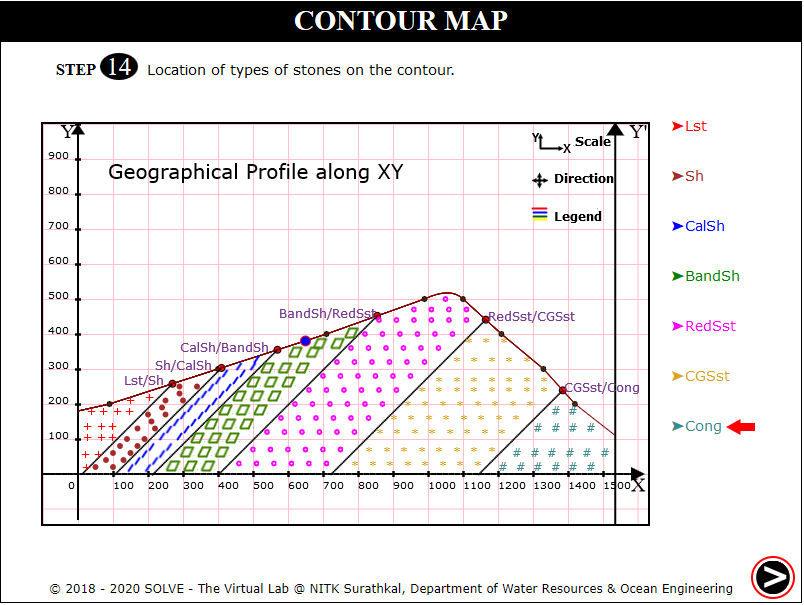
Click on Mark Borehole, to locate the borehole location. Click Next.
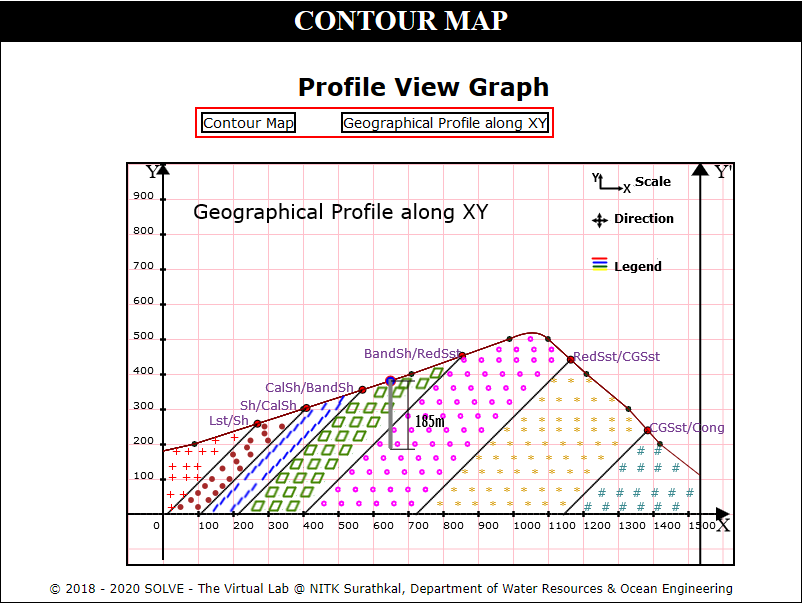
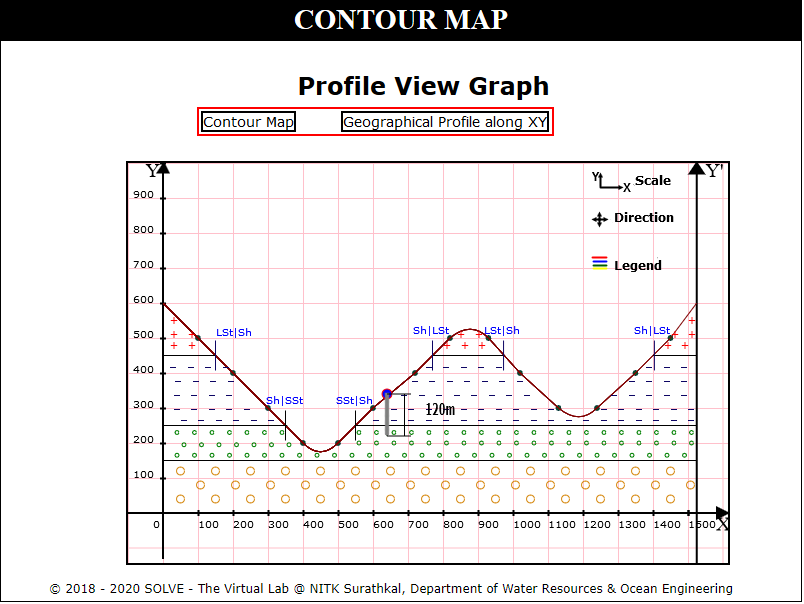
Click on each label button to see the different graph.
Contour Map 2
When you click on a Contour Map 2 file, a new window will open, click on the Next button at the bottom right corner to move to the next step.
Click on to identify the location of the borehole. Click Next.
Click on Get paper and Mark Points to mark dotted lines intersecting the XY profile. Click Next.
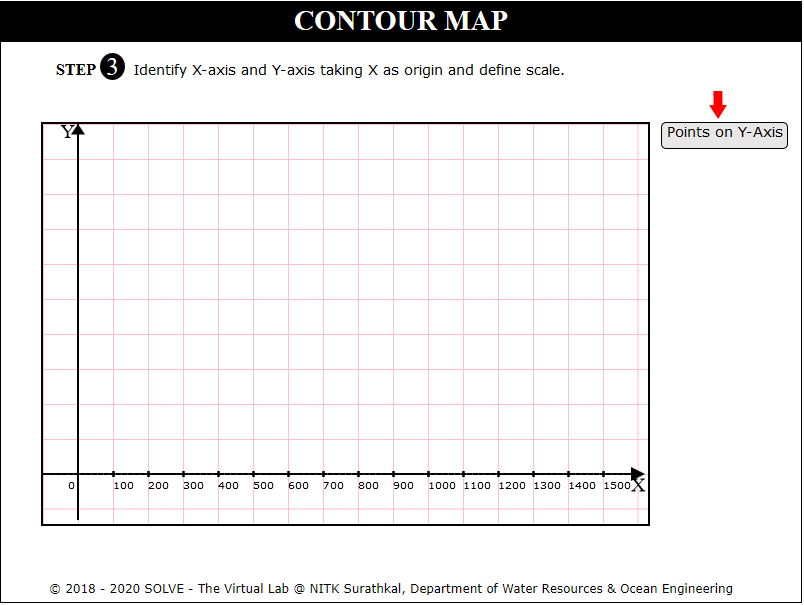
Click on Plot X Axis, Plot Y Axis, Points on X Axis, Points on Y Axis to plot axis of the graph. Click Next.
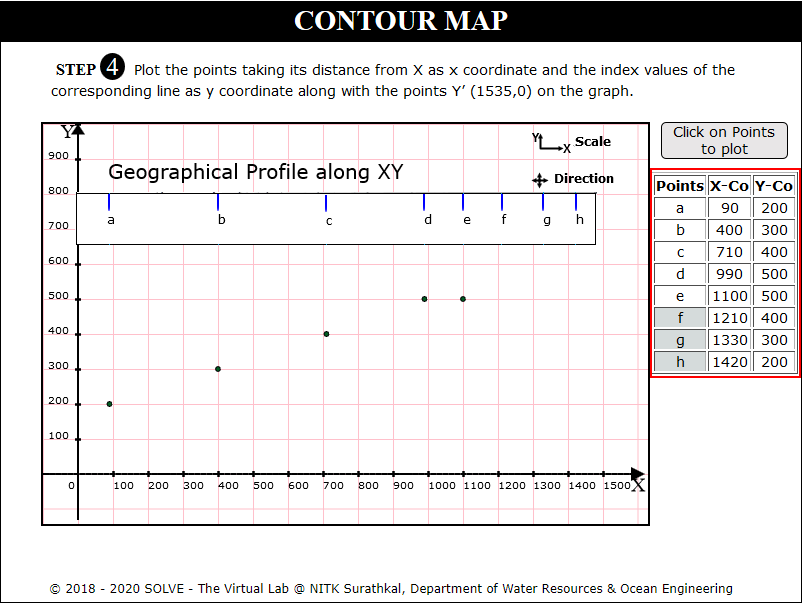
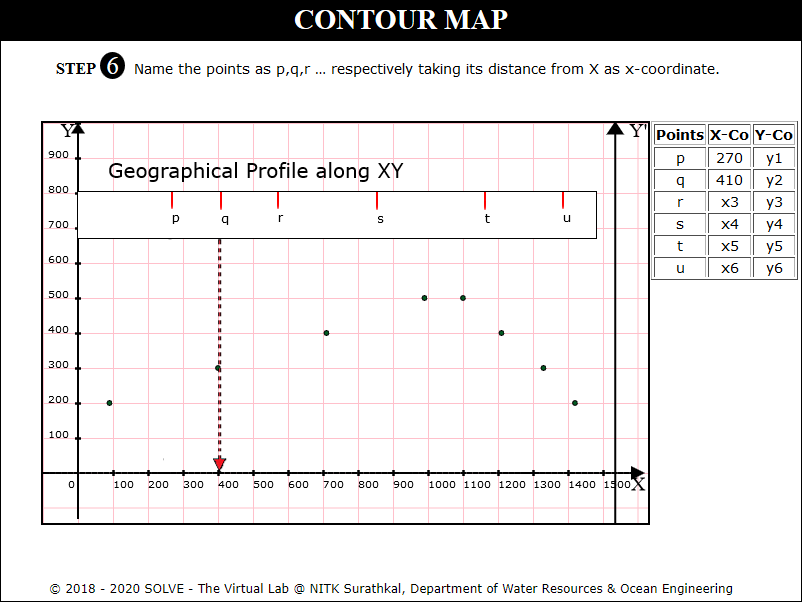
Click on Define Coordinates and click on each point to plot on the graph.
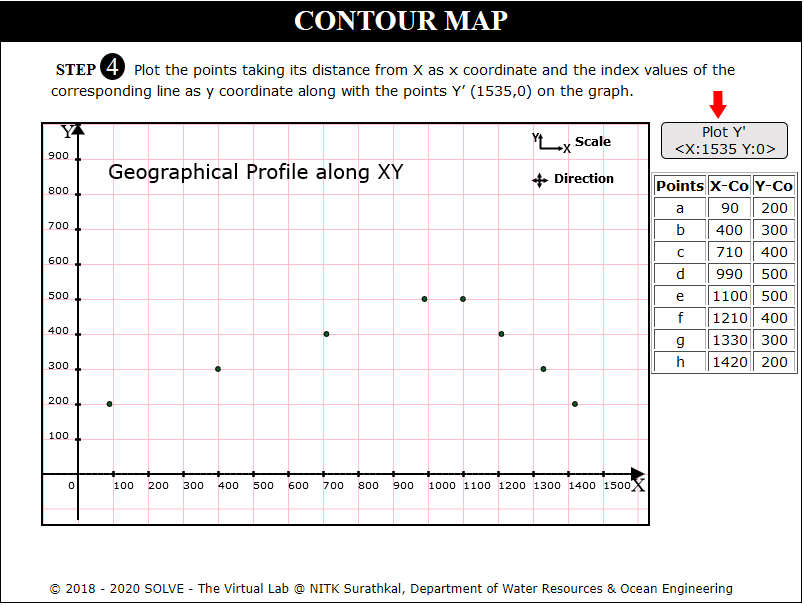
Click on Plot Y' X:1535 Y:0 to draw perpendicular line at Y=1535. Click Next.
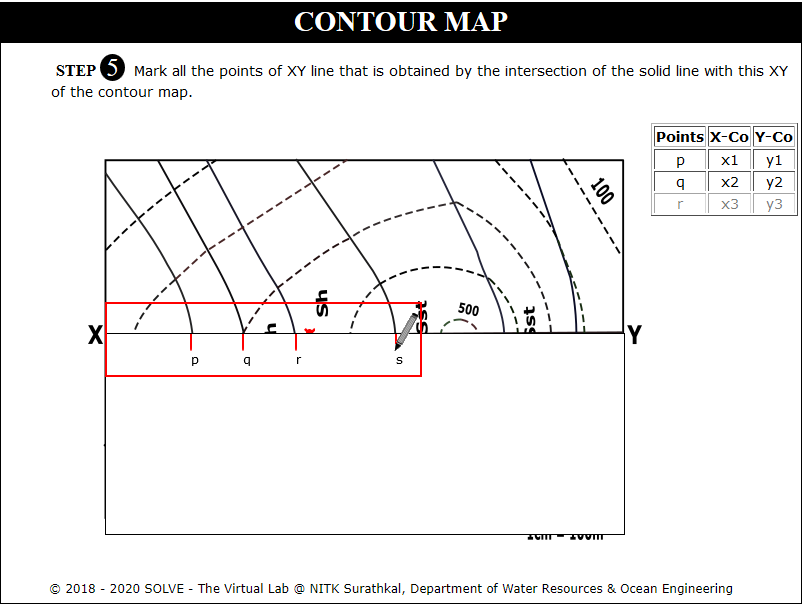
Click on Get paper and Mark Points to mark solid lines intersecting the XY profile. Click Next.
Click on Define X Coordinates and measure points distance from X Axis.
View the instruction and formula to calculate the Index value. Click Next.
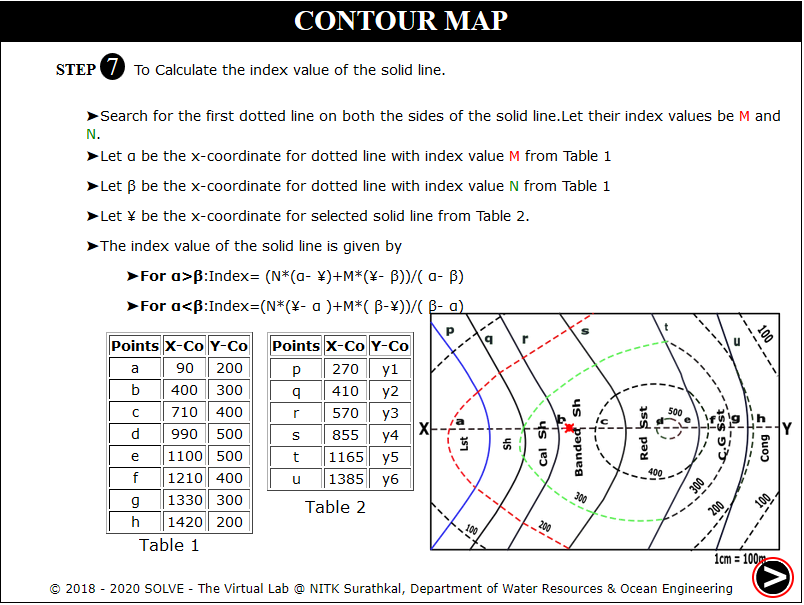
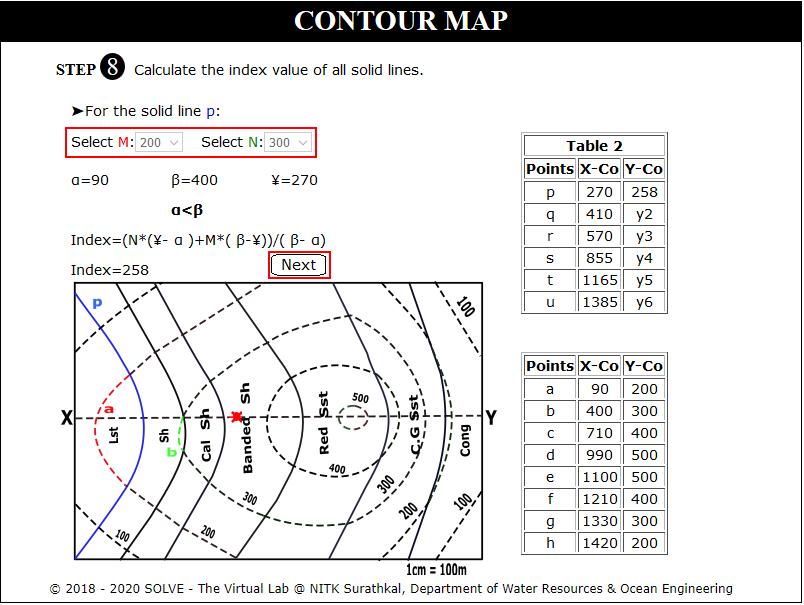
Click on to give appropriate M and N value for calculating the Index Value, Click Next.
Click on Points to plot to plot points p to u on the graph. Click Next.
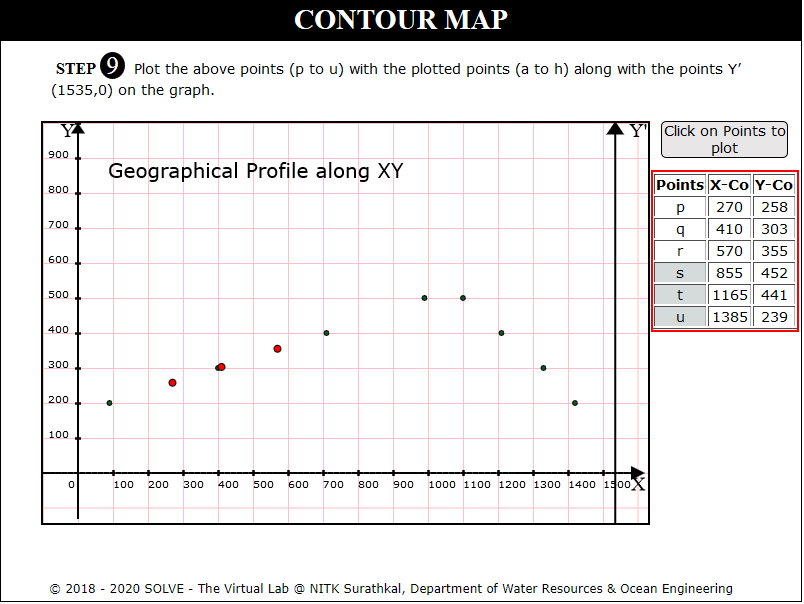
Click on Join Points to join the plotted points on the graph. Click Next.
Click on Mark Borehole point to locate the borehole on the graph. Click Next.
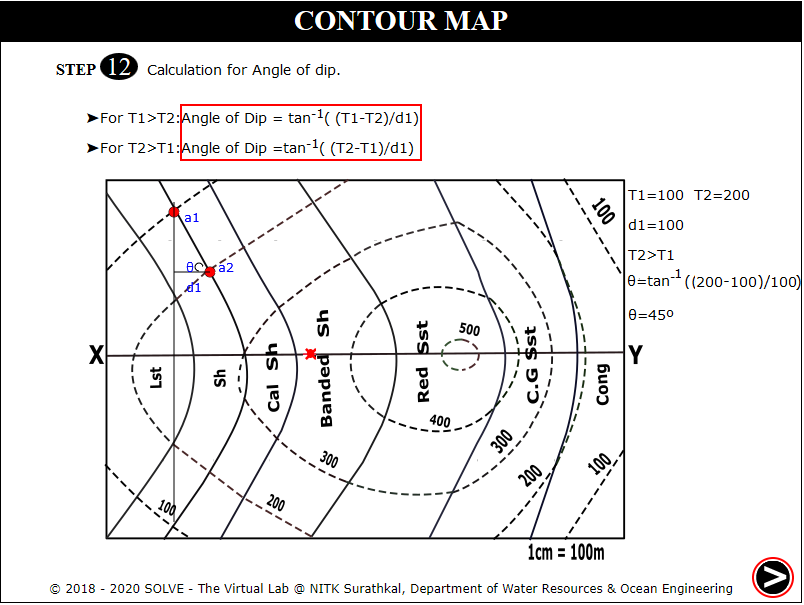
Calculate the angle of dip at points where solid lines and dotted lines intersect, Click Next.
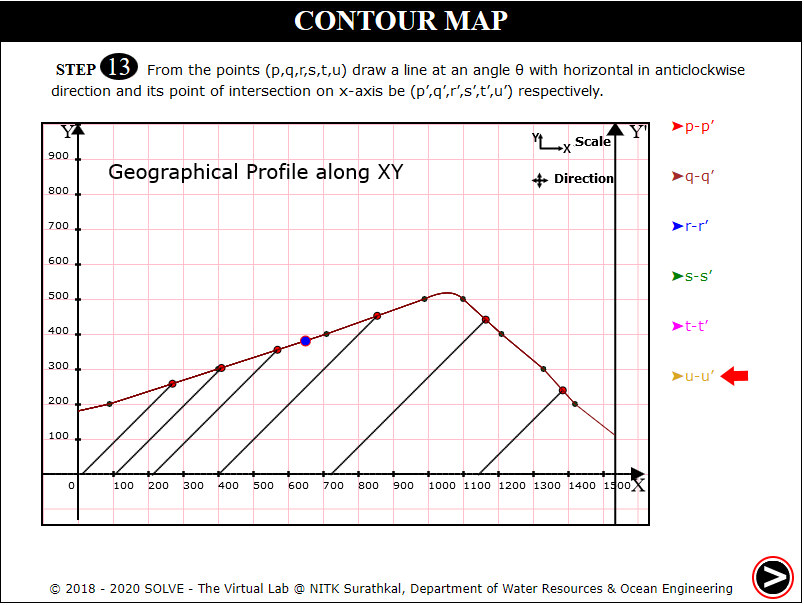
Click on to draw lines at an angle with horizontal. Click Next.
Click on stone type to view the stone distribution along the section. Click Next.
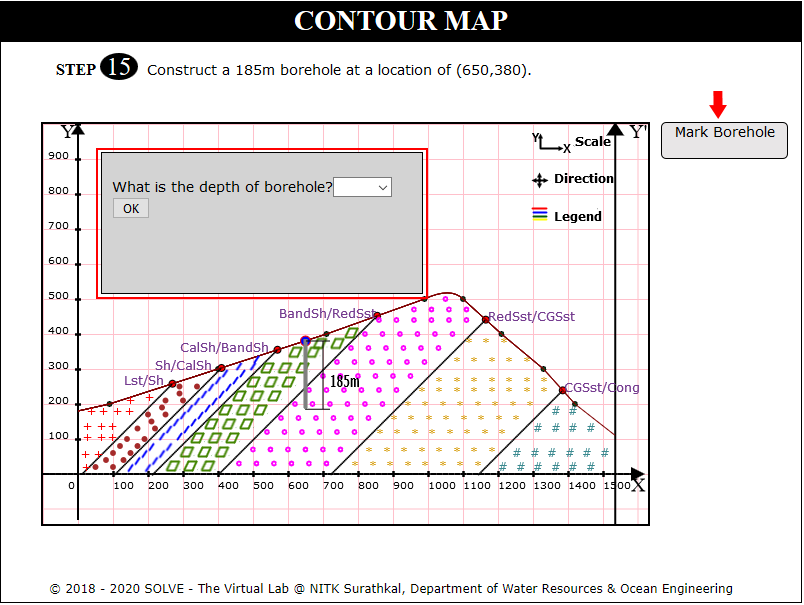
Click on Mark Borehole and answer the question displayed. Click Next.
Click on each label button to see the different graph.